Introduction
This was an internet of things project with big data storage and analysis.
Monitoring of air quality has become a lot easier in the last few years with the advent of small solid state sensors that are capable of doing a similar job to equipment originally designed for laboratory work which is what is in those large stations that are occasionally seen at traffic intersections.
The objective of this project was to build small monitoring stations, about the size of a large book, that could be easily mounted on buildings the data being sent back wirelessly to servers where it can be collated, displayed and supplied to other interested parties.
Initial system configuration:-
Air Monitoring Stations
Sensors used were developed by Alphasense and mounted on their standard boards which were interfaced to a bespoke processor board doing A to D conversion and generating 5 minute blocks of data which were sent using https: to the data acquisition servers, the boxes being masters.
Data collected was Temperature Deg.C, humidity, acoustic (noise level), NO2, NO, O3, SO2 and CO in PPB and Particulates PM1, PM2.5 and PM10.
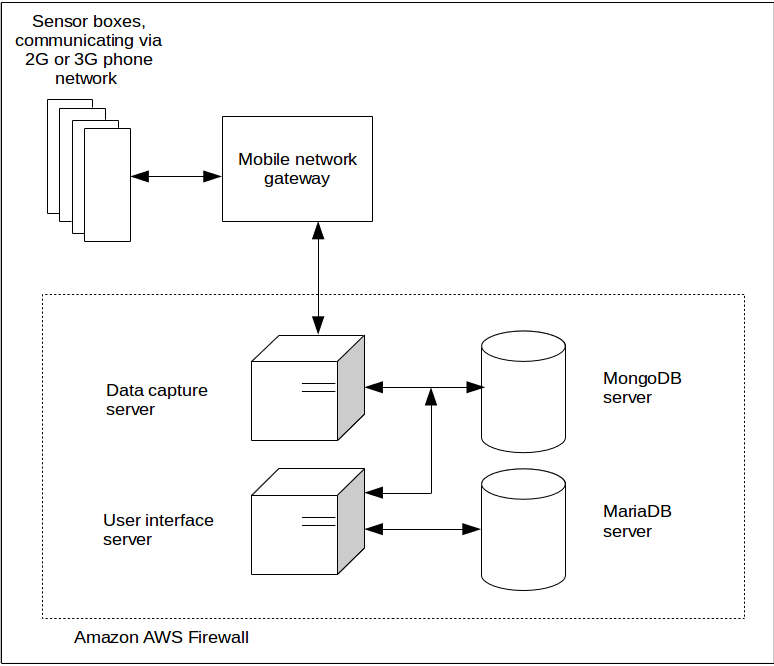
Blocks of data were sent to the acquisition server in a compressed json format over 2G or 3G network using https via the mobile network gateway. The server reply data block could do things like sync the clock to UTC, change the sampling rates of various sensors, ok the data blocks received and, eventually, request the box to upload new software from the distribution server.
Eventually we were going to move away from http, as it is quite a bulky protocol, to CoAP as it is a lot faster and more compact thus saving a lot on mobile network bills, also uses a lot less power.
Data Acquisition and Storage
Deciding on the databases was one of the big decisions at the start of the project. The sensor boxes were obviously going to produce large amounts of data and, depending on the time slice or configuration of the box, different sets of sensor data, both of these challenges made a standard SQL database not the best choice for the job. We chose MongoDB in the end since it could handle the expected amount of data with out slowing appreciably and variable contents for any particular time slice was not a problem since it was a document database.
Once a data block had been received by the server it was checked for validity ie. valid sensor box id, tokens and type, the compressed message block was converted into a more readable json format based on the configuration of the box's sensors and this saved for a month in case we needed to re-generate due to configuration mistakes.
The next step was to convert the voltage produced by each sensor to the equivalent value in say parts per billion for NO2, this involved standard equations for the type of sensor, constants from tests carried out on the sensor after production and the temperature when the sensing was done. Again the block was saved giving the most accurate data for that sensor box.
Another data set produced from the received block was one and ten minute averages. The one hour average was produced once enough unprocessed data had accumulated in the ten second collection.
A future enhancement for the calculations was to be to use machine learning to find out how the sensors changed as they aged and correct for this.
Configuration API
Configurations for the boxes needed to be created for new boxes and updated at times for old ones. An API was instituted to achieve this which was ip and key locked to another system which had user interfaces for this.
Data Display
Visitors to the site could see a map of the UK with all the public boxes marked. Hovering over the pin showed current status, clicking moved to a data display page for that box.
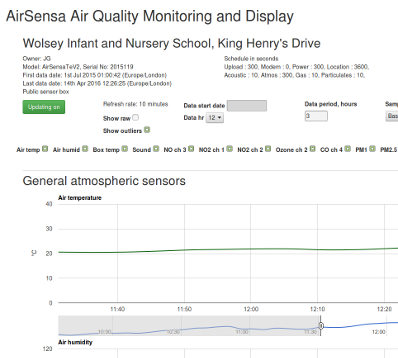
Users could change the displays as follows:-
- Date and start time
- Number of hours shown
- Sample rate 10s, 1 minute, 10 minute and 1 hour
- Types of sensor data displayed
- Also outliers and raw data
The plots were created using Google graphs and showed the local time and date when the data was collected. This was an interesting challenge as Google graphs assumes the time is in UTC and does an offset to show it in the browsers local time so I had to find out what that was and do some interesting maths to trick the graphs into showing the correct time and date.
User Authentication
User authentication was implemented so that private sensor boxes could only be seen on the map and the data by the users that owned them, the first of those was a company putting sensors to monitor temperature, humidity, carbon monoxide and ambient sound level in council and rental flats.
API's
Two API's were implemented on the front end system. One to allow user creation and box ownership to be defined from another system, the second was to allow the company putting sensor boxes into flats to request the data collected.
Future API was going to be a general data outlet for the public boxes and private boxes if the user has appropriate authentication using OAuth.
Rate Limiting
All the API's and some of the other end points were rate limited to prevent users from hammering them and slowing the system.
Testing
All API's had tests written for them using Codeception a php testing framework, both success and fail were tested for to ensure a solid result. Eventually tests were going to be written for the rest of the software.
Future Development
Queuing was to be implemented on the data capture using Apache Kafka so that any hold up with the database would not stall the input side and further queues used for distributing the data to other clients.
Data capture servers would be put behind a load balancer to ensure no stalling of the collection.
Lots and lots of visitor utilities for consuming and displaying the air quality data.